Making your data reliable
What it is for
Your portfolio is described in Stonal as a nesting: a property contains buildings, a building contains zones, a zone contains equipment.
This report lists the places where that nesting does not hold: a building attached to no property, an empty property, a zone still present although the building containing it has left the portfolio.
These inconsistencies are not just awkward to read: they distort figures elsewhere. A building attached to nothing can go missing from the counters on the home page or from a report, with nothing to flag it.
How to get there
⚙️ Settings in the sidebar › Data reliability.
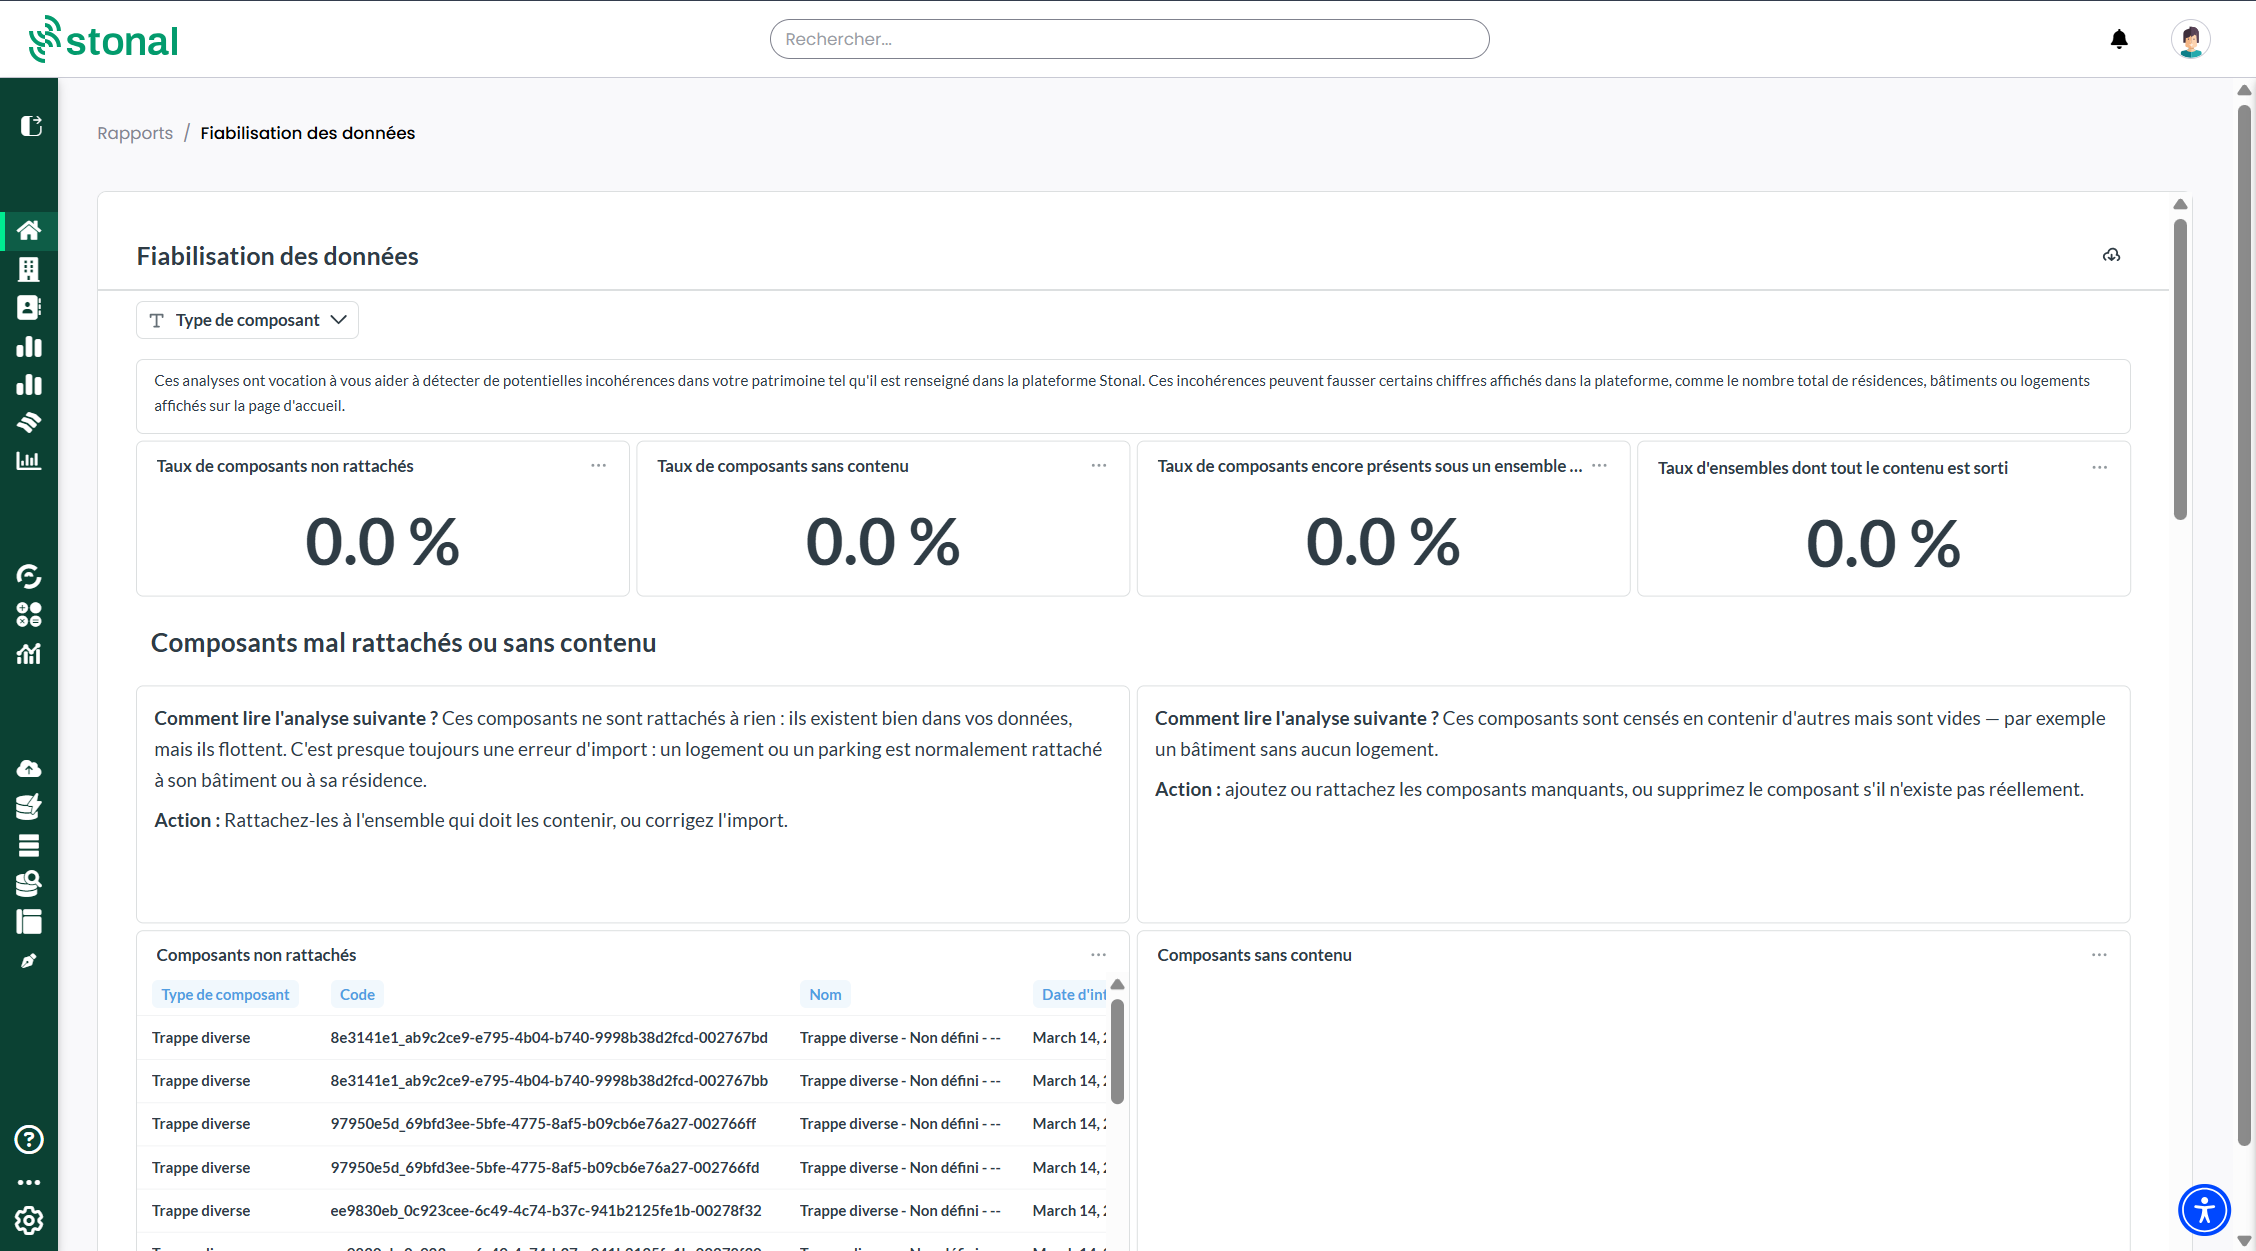
The four anomalies tracked
At the top of the page, four percentages give you the scale of the problem. Below them, four tables tell you exactly which of your components are affected.
Unattached components
A component that is attached to nothing: a building belonging to no property, a zone belonging to no building.
It does exist in your data, but it floats. This is the most common anomaly, and the one that most often explains a discrepancy in a count.
Components with no content
The opposite: an empty container. A property with no building, a building with no zone.
Only components meant to contain something are checked. A unit or a parking space never appears here: they are terminal components, and it is normal for them to contain nothing.
Components still present under an exited group
A zone still in your portfolio although the building containing it has left it — sold, demolished.
In almost every case this is an exit that was not propagated: the building was dealt with, its contents were forgotten.
Groups still present although all their content has gone
A building still present although everything it contained has left. Normally it should have left too.
Unlike the other three, this one is not a counter to bring down: it is an alarm. When all of a group's content leaves, the group leaves with it. If it shows anything other than 0, an exit went wrong.
Reading the percentages
Each rate is measured against the population that can actually be affected, not against your whole portfolio.
"3% of components with no content" means 3% of the components meant to contain something — not 3% of your entire portfolio. That is what makes the figure readable: across 50,000 units, an anomaly measured against the total would always sit near zero and tell you nothing.
Finding the components affected
For each component, every table gives its type, its code, its name and its integration date.
Three filters narrow the view: Agency, Component type, and the identifier of one specific component.
Anomalies sharing the same date usually come from the same load. Dealing with them as a batch is quicker than component by component.
Correcting
The attachments between components come from your source data. They cannot be corrected from the platform's screens: neither a component's record in Checking your data nor the bulk edit in the query tool lets you change what a component is attached to.
Export the list, then speak to your usual contact: the correction happens upstream, where your data is produced.
See also
- Checking your data — where a value came from and its history, component by component
- The home page — the counters these inconsistencies can distort