Querying your data
This page concerns organisations running Graphlake.
What it is for
The Query tool lets you view and export all the information held in the platform, and update your data in bulk to improve your portfolio.
It is the free-form query tool: you define a scope with filters, you choose the information you are interested in, then you export or you correct.
Before you start
This module is generally open to Graphlake organisations. If you do not have access to it and you need it, ask your internal contact.
The screen explained
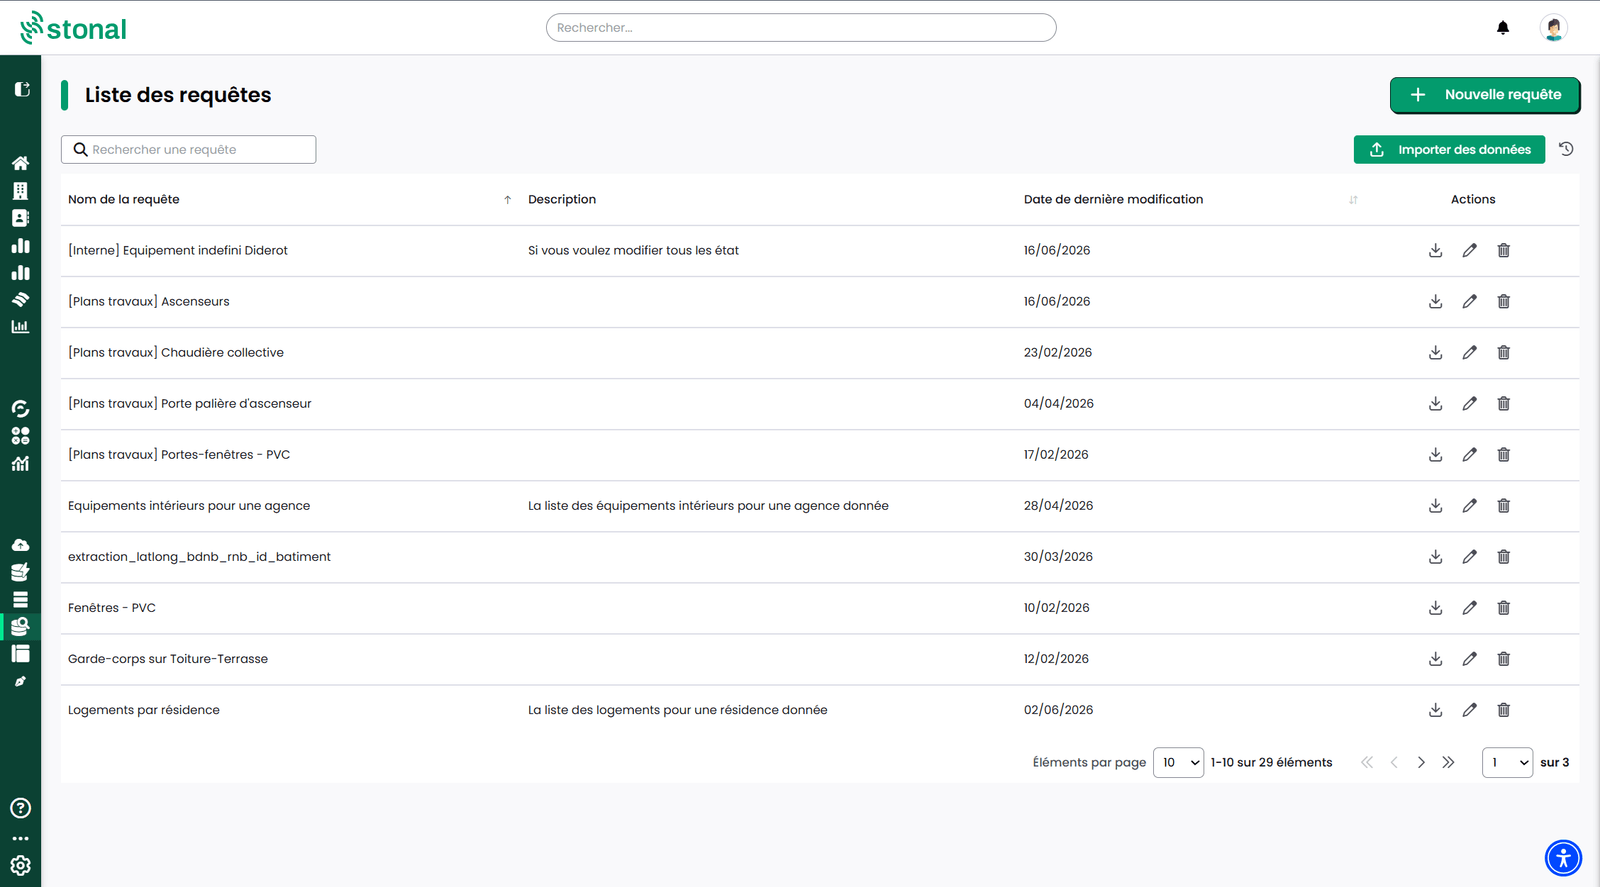
The home page lists your saved queries, with their description and the date they were last changed. From the table you can:
- open a query, adjust its settings and see its results;
- create a new query;
- download the results as CSV;
- edit the name and description, or delete — depending on your permissions.
A query you save becomes visible to every user in your organisation, not just to you. That is what makes it worth saving — a useful query benefits everyone — but keep it in mind when naming it.
Step by step
1. Define the scope with filters
This first step is where you narrow things down to what interests you: a few properties rather than the whole portfolio, one specific equipment type, the dwellings built before a given date… Everything you see afterwards covers that scope, and only that scope.
A filter has four parts: a component (the type of item: property, building, unit, equipment…), a property, an operator (greater than, less than, equal to…) and a value.
You combine them with AND or OR, including across several components.
- "Add a component" to choose the type of item.
- "Add a filter" to set a condition. Repeat to stack them.
A concrete example: equipment in "poor condition" or "dangerous condition", in buildings acquired before 2020 with an EPC rating of C.
You can select several sub-types of the same component in a single query — equipment, level, graphical building, space, wall, zone. This lets you target, for instance, sanitary fittings and lighting equipment in one go. The filters then apply to the whole selection.
2. Choose the columns
Some information is already selected: whatever you used to narrow down your scope at the previous step.
You can add anything else you want. The overall condition of your equipment, its power rating, the construction date of a building: select that information and it appears as extra columns in your results.
To do so:
| Action | Effect |
|---|---|
| + Property | Add properties of a component |
| Add a component | Add new columns |
| Cross | Remove a property |
| Bin | Remove every property of a component |
| Preview | See a preview at any time |
Adding or removing a column does not change the filtered scope. You can filter on a property without showing it, and the other way round.
At any point, "Preview" shows you a sample of the result without leaving the settings. It is the habit worth forming before running the query: you check you have the right scope and the right information, rather than finding out across thousands of rows.
3. Read, save and export the results
The next page shows all the results of your query: one row per item found, one column per piece of information selected.
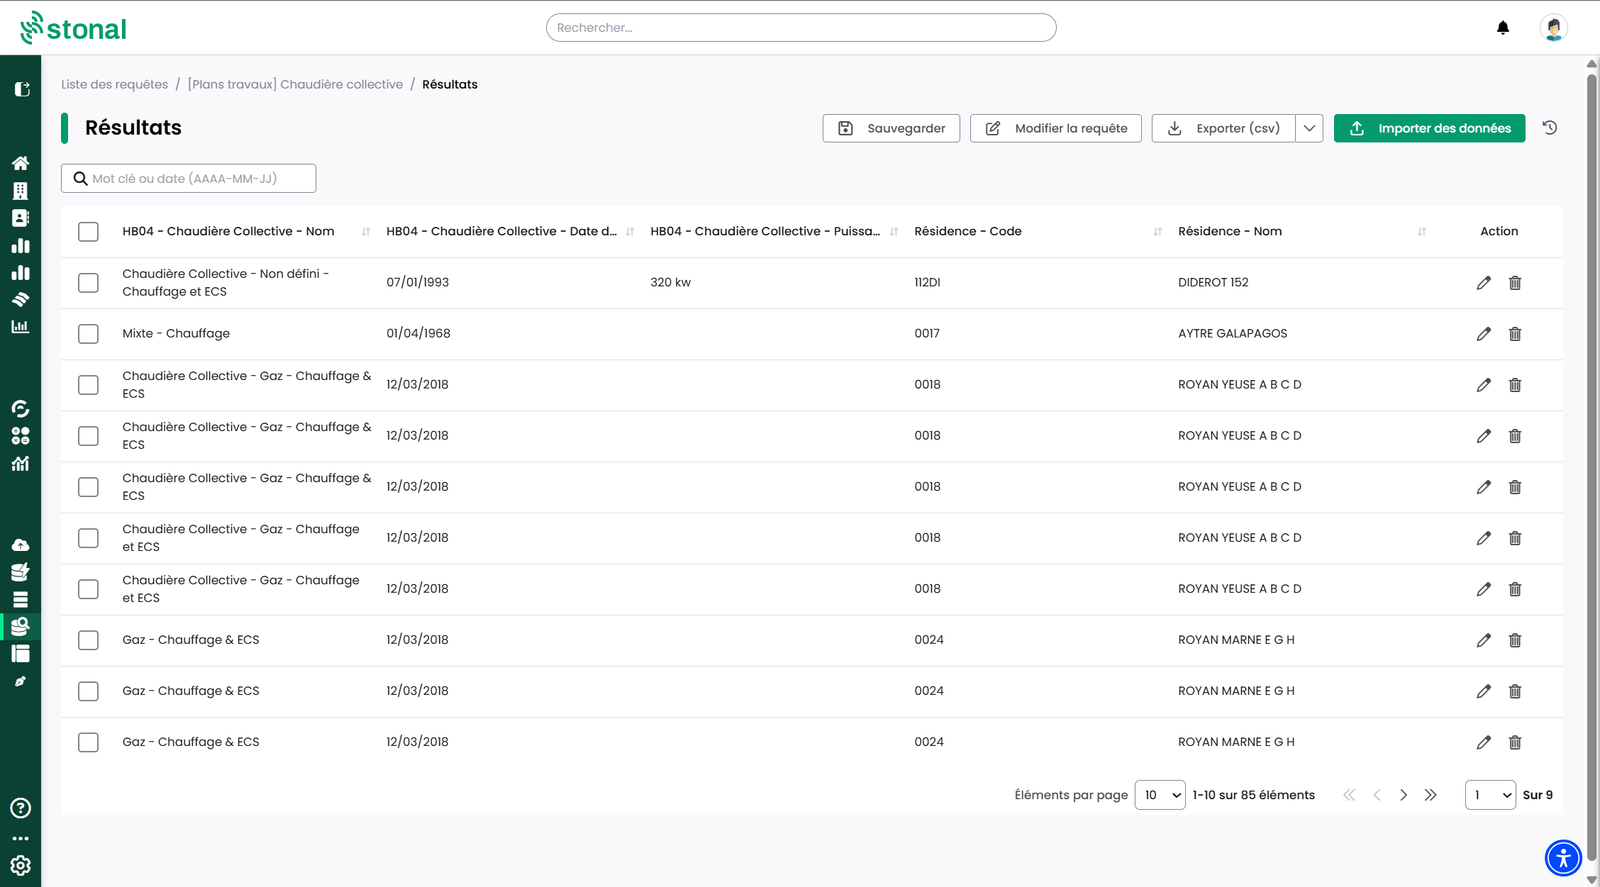
Each column matches a piece of information you chose at the previous step. Its name is prefixed by the component it belongs to:
| What you are after | The column name |
|---|---|
| The property's name | Property – Name |
| A boiler's condition | Boilers – Condition |
That prefix is what tells you what each value attaches to, even when two components carry information of the same name.
Three actions are available on this page:
- Save the query — it then becomes available to your whole organisation, so it is easily reusable and shareable. You will not have to rebuild it next time.
- Export (csv) — you get every result in a file, with the same columns as on screen. It is the format that opens in Excel and any spreadsheet: enough to rework the data, pass it on, or compare it with another tool's.
- Edit the query — you go back to the settings, filters and columns intact, to adjust and run it again.
4. Multiple actions
The query tool is not only for reading your data: you can also change or fill in the information recorded, across as many rows as you like, without leaving the results page. It is the quickest way to correct a missing or wrong value on a large number of items at once.
If your permissions allow it, this happens straight from the results.
- Select the rows: the pencil on a row for a single correction, the box at the top left for the whole table, or the boxes row by row. A bar appears at the bottom of the screen reminding you how many results are selected.
- Click "Edit data". A panel opens on the right, in two steps: first choose the component type concerned, then edit the data.
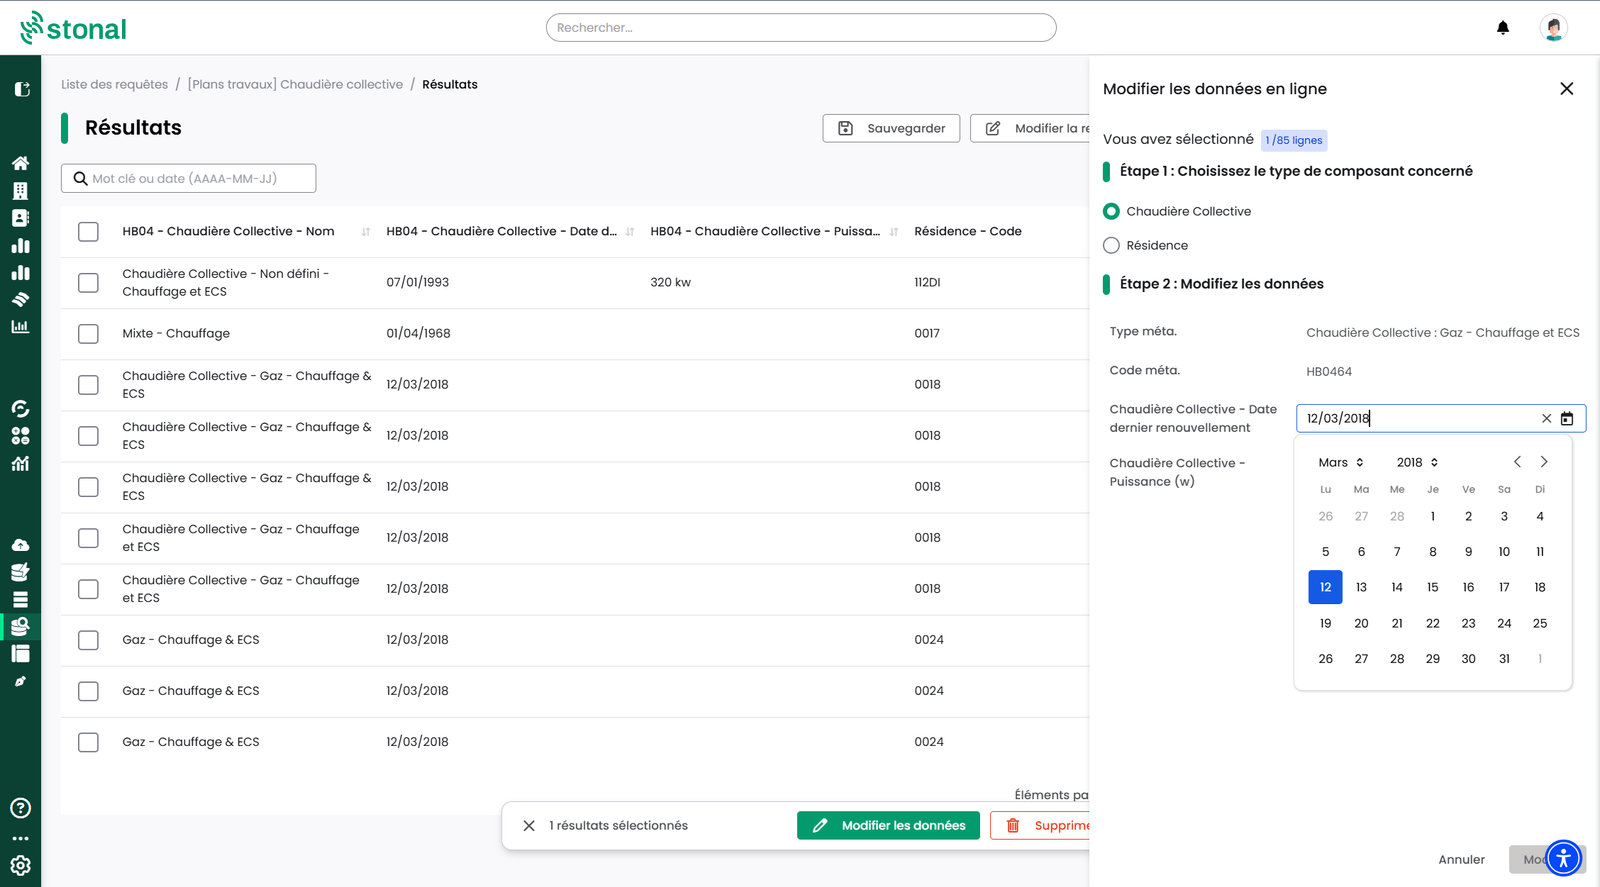
The panel reminds you how many rows are selected, and offers one field per property shown as a column — with the right input type, a date picker for a date for instance.
The edit window only offers the columns present in your table. If you want to correct a property, add it as a column first.
Bulk editing can take several minutes. A notification at the top right keeps you informed of its progress.
Good to know
Automatically calculated areas (floor area, SHAB, SDP) are indicative and do not replace a certified measurement.
See also
- Checking data
- The unit record — completing the data of a unit