Representations, the geometry of your Assets
As we saw on the Assets page, an Asset can carry, on top of its information (name, type, area…), a representation: it is what defines its geometry. Anyone can write this representation, in the JSON format seen on the previous page, but few do it by hand. It rather comes from building models: the Stonal Connector add-in knows how to rewrite the geometry of Revit elements in the right format, that of Stonal representations in JSON.
Knowing these representations helps you read your plans, and understand why an element shows up in a given place, or why it was calculated the way it was.
Exploring the five types of representation
The box (box)
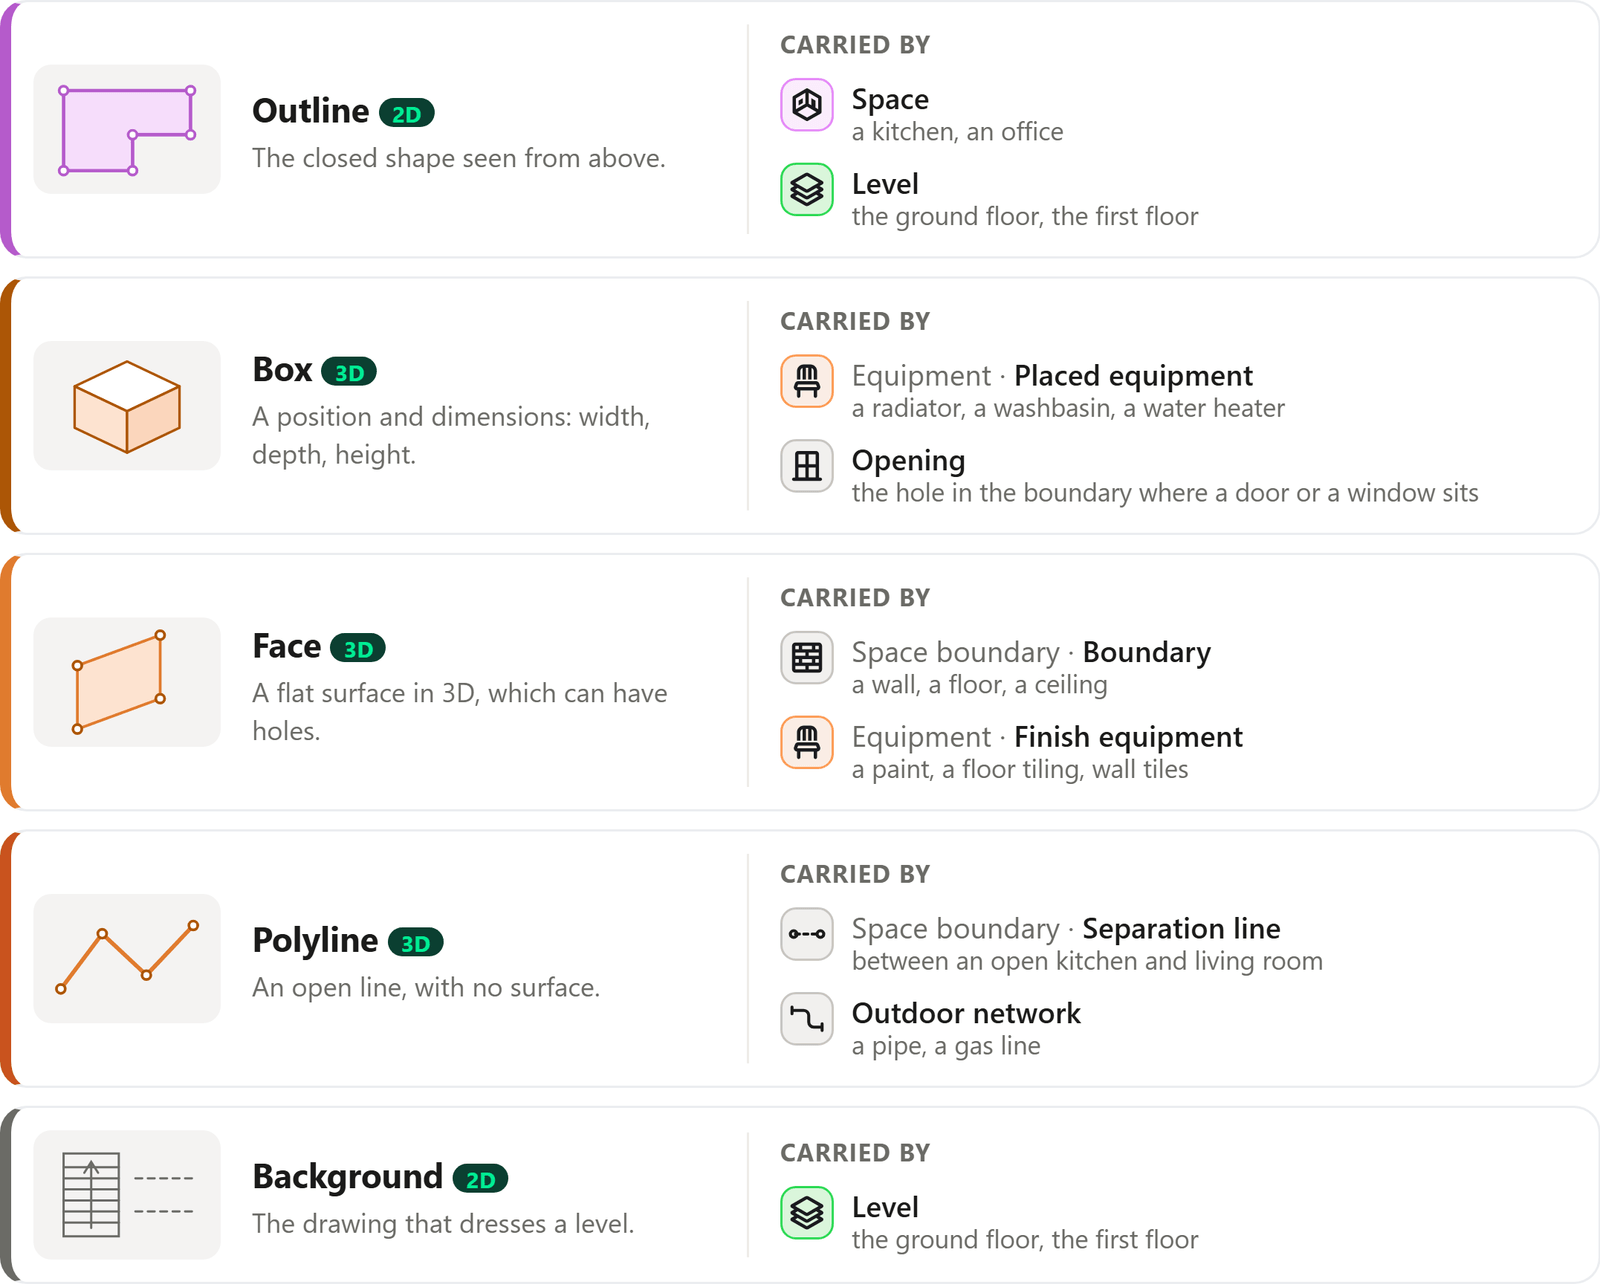
The box is a footprint, in three dimensions. That makes it the ideal representation of any piece of equipment placed in a room, such as a washbasin, a bathtub or a radiator, but also of the footprint of an opening: the hole in the wall where a window or a door sits.
It fits in four values. Let's build a washbasin's together: let's add the values one by one, and see what each one draws.
Click “+ Add” to write the JSON line by line and see what each line draws.
Let's build a washbasin's envelope, line by line.
The outline (outlines)
The outline is the footprint of an Asset, such as a space or a level: its shape seen from above, in 2D. It is mostly used to draw the plan.
It is written as a list of rings of points, each with two coordinates x and y, in centimetres: the first ring is the outline of the Asset, the next ones are its holes. Let's build the outline of an L-shaped kitchen with a column, point by point.
Click “+ Add” to write the JSON line by line and see what each line draws.
Let's build the outline of an L-shaped kitchen, seen from above, point by point.
The face (face)
The face is a flat surface in 3D. That makes it the ideal representation of a room's boundaries (wall, floor, ceiling), and of the finish equipment that covers them: a paint, a floor tiling, wall tiles.
It follows the same principle as the outline, with a third dimension: each point gains a z. So it is also written as a list of rings, the first for its outline, the next ones for its holes. Let's build one with a hole, point by point.
Click “+ Add” to write the JSON line by line and see what each line draws.
Let's build a face, point by point.
The polyline (polyline)
The polyline is a line in 3D, with no surface. That makes it the ideal representation of outdoor networks, such as a pipe or a gas line, and of virtual limits, those no boundary marks out, between an open kitchen and living room for example.
It is written as a series of points x, y and z, in centimetres. In the room below, the boundaries already have their faces: let's add the limit between the kitchen and the living room.
Click “+ Add” to write the JSON line by line and see what each line draws.
A kitchen open onto the living room: the boundaries have their faces, but no boundary separates the two spaces.
The background (background)
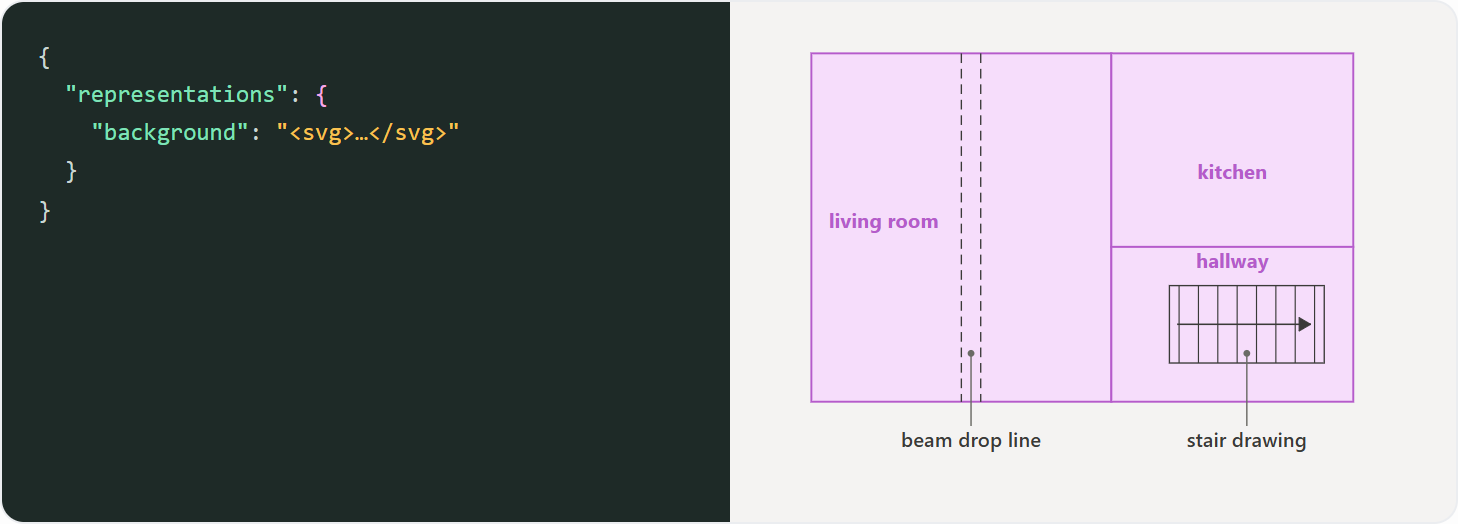
The background is the drawing that dresses a level's plan: stair drawings, beam drop lines, CAD drawings… We won't go into the details of this representation: it is simply a copy of these context drawings, converted to SVG and stored as they are, as plain geometry with no link to the other Assets. It is only there to dress the plan.
Putting it all together: the kitchen rebuilt
Combining all these representations gives a piece of the portfolio that makes sense: the space Asset with its outline, the space's equipment with their boxes, its openings, the faces of its floor, walls and ceiling, the virtual limit that separates it from the next room… Let's rebuild the kitchen, one representation after another.
In short: each Asset and its representation
As we have just seen, each Asset, according to its type and sub-type, carries the representation that best fits its physical reality: nothing beats a box, for example, to represent the footprint of a placed piece of equipment such as a radiator. Here is the summary of the five types of representation, with the Assets that carry them.
What the representations are used for
Once stored, the representations are mainly used for two things: drawing the plan of the Plans tab, and computing quantities. They can have other uses too.
Drawing the plan
To draw the plan, the platform flattens the representations and looks at them from above.
Of course, this is only a simplified picture: the Plans tab is far richer, and holds far more detail. For example, it does not leave the equipment as bare boxes: it dresses each one with the symbol of the matching equipment. As you can imagine, it is the equipment's type that guides this dressing.
Computing quantities
The platform also takes quantities from the representations. It analyses the outlines and the faces to get areas: from the faces of a sloped ceiling under the roof, for example, it finds the zones less than 1.80 m high, to exclude from the legal areas. It also analyses the boxes of the equipment, to get volumes, among other things. Added up and summarised, these measurements become metrics, which are Stonal's added value: the area to repaint, for example.
Important to know: the representations do not feed the 3D viewer
As you have seen, most representations are in 3D. This is what lets the platform take accurate quantities from them, the ones that matter for management and maintenance.
The Plans tab also offers a 3D viewer. What you see there is not made of the representations on this page, but of another format:
- The 2D plan and the quantities come from the representations, carried by the Assets. These Assets can come from several sources, the Revit model included.
- The 3D viewer shows the Revit model itself: while it produces the Assets, the Stonal Connector add-in exports the model as an IFC file (the open, standardised format for exchanging building models between BIM software), then converted into a format the viewer can display.
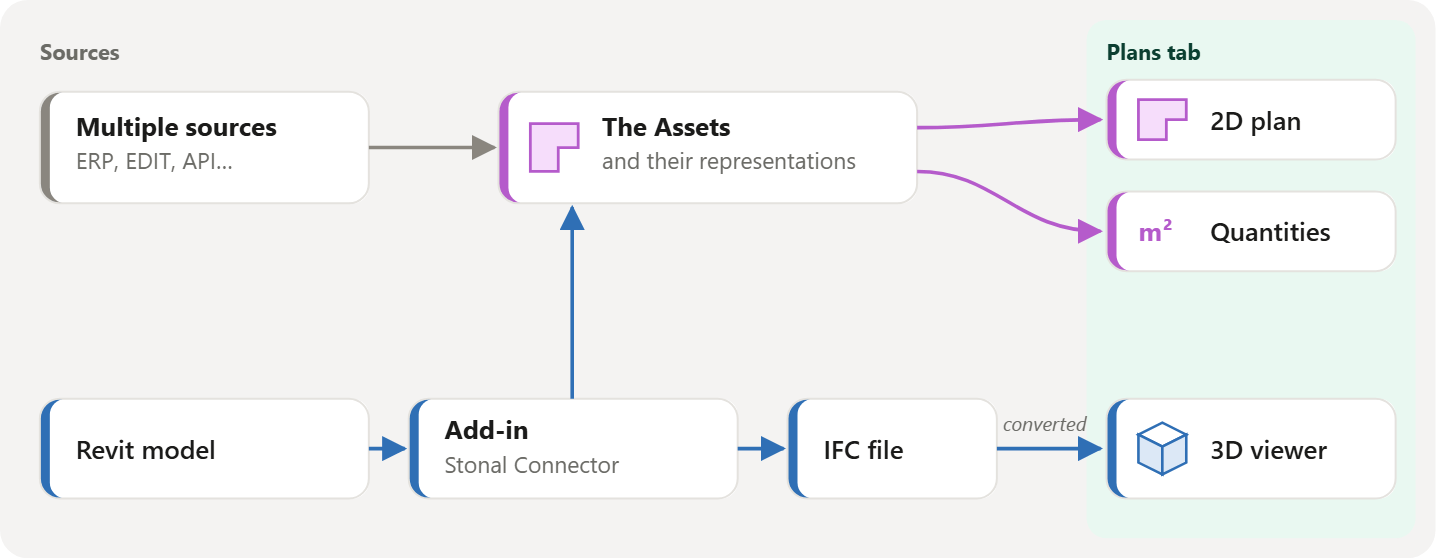
The two do not serve the same purpose. The representations stay simple on purpose, like footprints: for management and maintenance, accurate geometric information matters more than the look of the drawing. Even though we offer a 3D viewer, which gives the context of the building and lets you appreciate the building models, far more detailed than our representations, it remains a bonus: Stonal's added value is portfolio management, not being yet another viewer.
Of course, this page does not go into every detail: representations have their subtleties. For example, when you create an outline or a face, there is a direction to follow to tell the solid from the void. Seen from above, the outline turns counterclockwise (CCW), the holes clockwise (CW). These are classic conventions for anyone who works with geometry, and the applications that create representations, such as the Stonal Connector add-in, take care of it for you.