Building your works strategy
Looking for something else? See Where to start.
What it is for
The Strategy module helps you decide which works to carry out, on which properties and for what budget. It answers questions such as:
- which works, for how much and on which properties, to bring my portfolio out of the F and G energy labels?
- with the budget I have, what is the best possible result?
- can I get a slightly lower but perfectly acceptable result while spending much less?
It works on five axes at once:
| Axis | What is measured |
|---|---|
| Energy renovation | The energy performance (DPE) label, consumption and greenhouse gas emissions |
| Summer comfort | How exposed residents are to heat, in degree-hours above 26 °C |
| Climate risk: clay | The risk linked to clay shrinkage and swelling (RGA) |
| Climate risk: flooding | The flood risk and how well the building is protected |
| Accessibility | The gap between your homes adapted for people with reduced mobility and the accessibility target quotas |
For each property, the module suggests costed works packages suited to the building. Across the whole portfolio, it then computes scenarios: the best combination of packages for your budget or your target, which you can compare side by side.
The PSP module completes this view by rating each property on its attractiveness, its technical condition and its market: see Rating your portfolio (PSP).
Prerequisites
The module starts from the properties in your portfolio. To be analysed, a property must be linked to a building of the French national building database (BDNB or RNB identifier). From there, the module fetches the useful public data on its own: building characteristics, energy performance certificates, Géorisques data, INSEE data for the municipality.
A property whose data is loaded has the Ready status. Only ready properties go into a scenario.
The screen at a glance
The module is organised in four pages:
| Page | What you do there |
|---|---|
| Dashboard | See how your portfolio spreads across each axis and spot missing data |
| Property portfolio | Search and filter your properties, open their record |
| Scenarios | Create, read, compare and export your scenarios |
| Customisation | Adapt works packages and prices to your own practice |
The dashboard
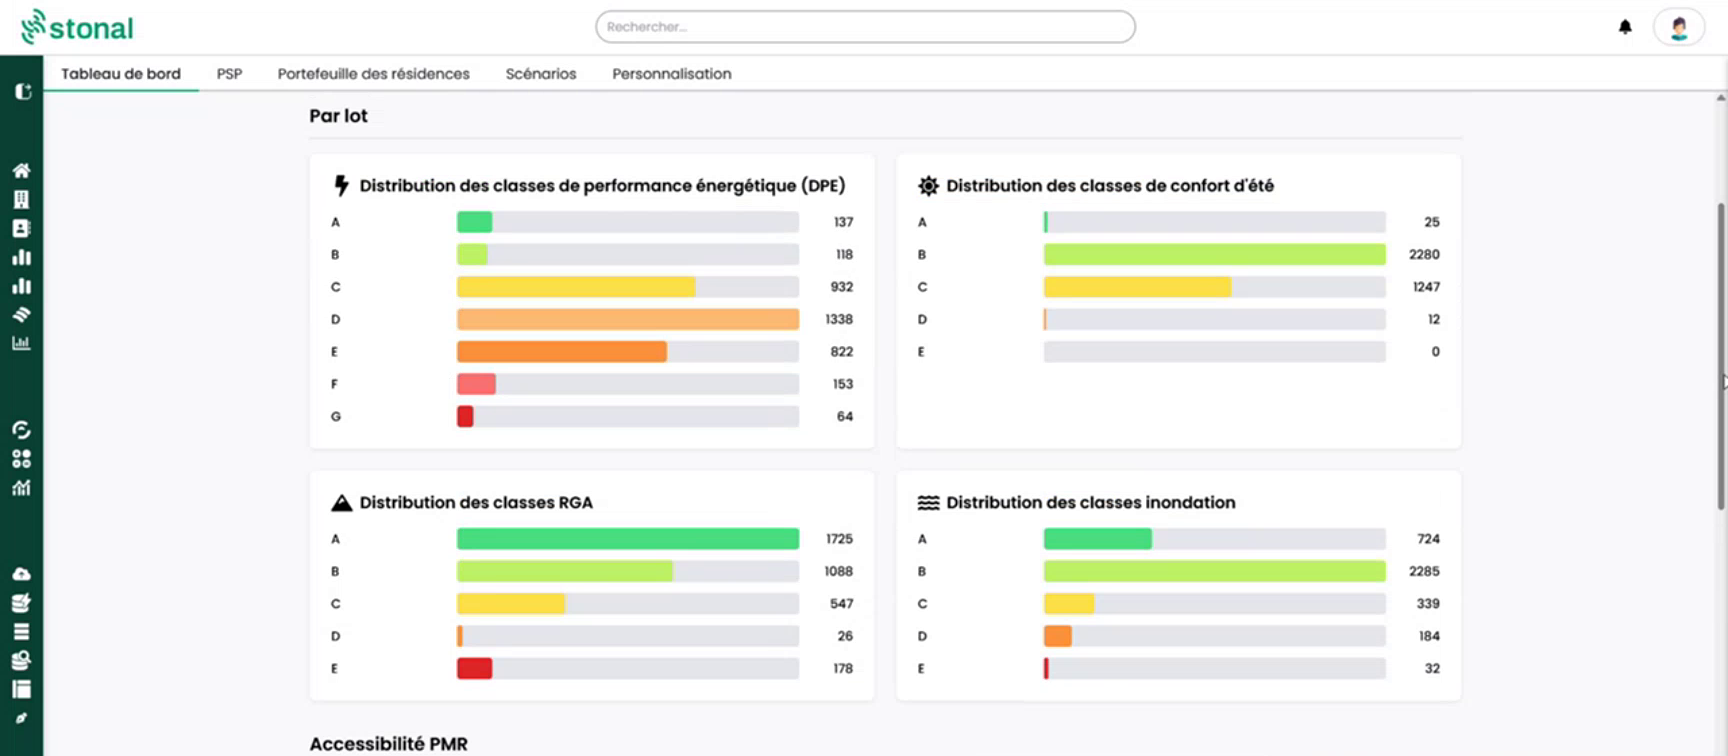
It shows how your portfolio spreads by class on each axis: energy labels, summer comfort, clay, flooding, accessibility. It also shows the split of heating energies and of insulation (external walls, ground floor, ceiling).
For accessibility, a table compares the adapted homes expected under the accessibility target quotas (Target quota) with the ones you have declared (Observed). The Score scope selector lets you include or leave out homes built from 2018 onwards.
A property's record
From the Property portfolio, open a property. Its record has one tab per axis. Each tab shows:
- the data used by the axis;
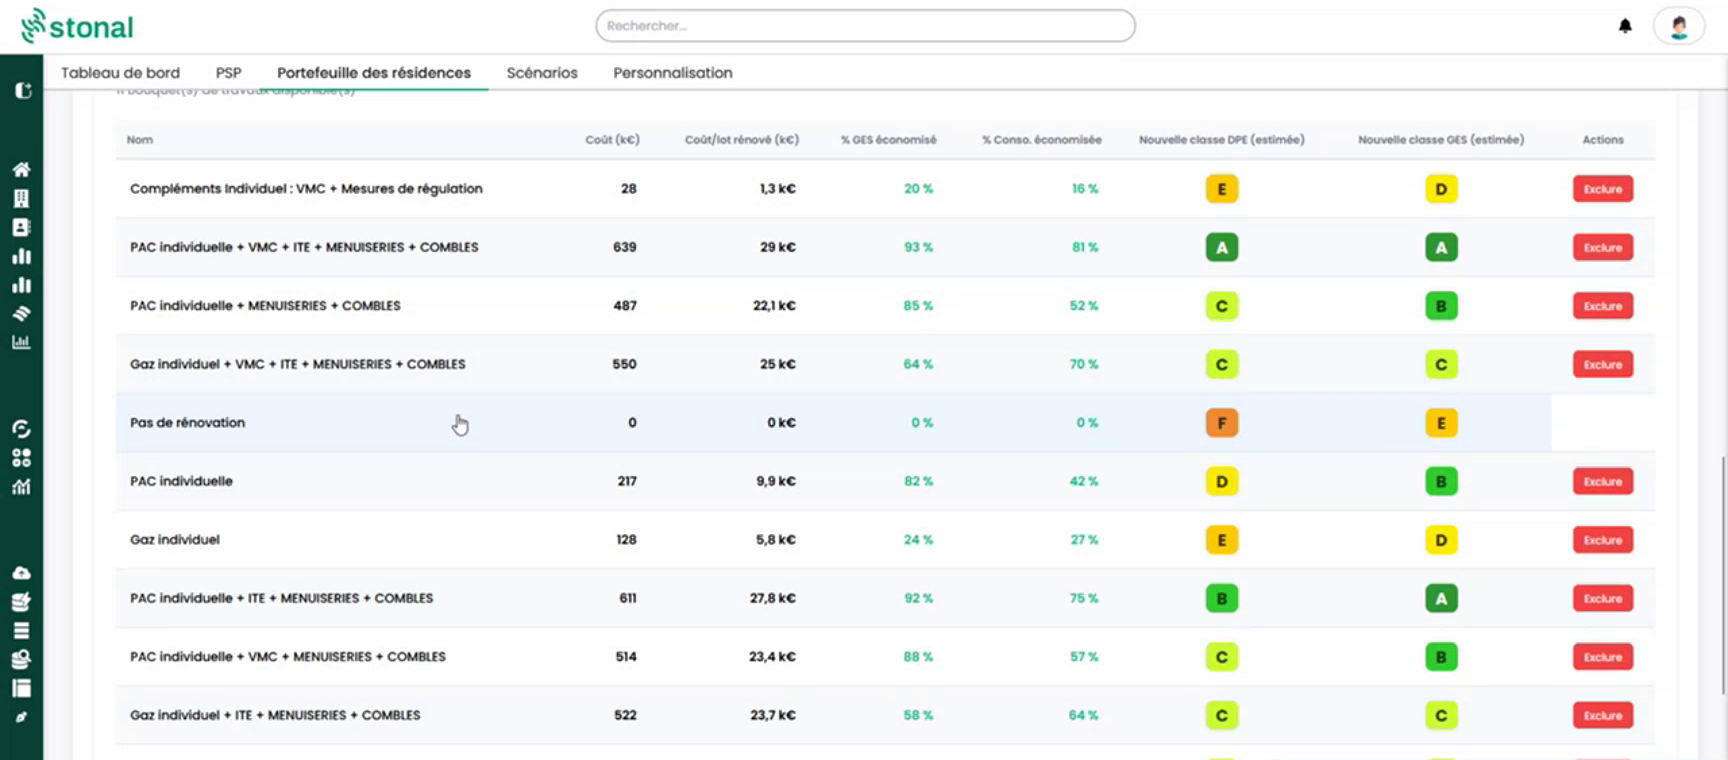
- the list of active works packages, with their cost, cost per home, new estimated class and expected gain;
- the list of inactive works packages, which the module will not use.
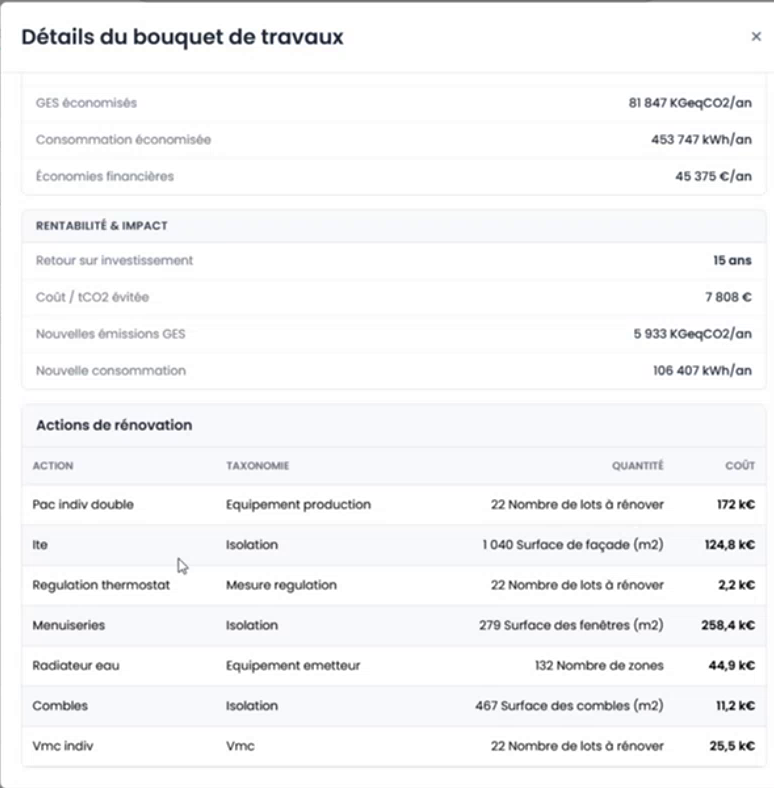
Click a package to see the detail of its works, with quantities and costs. For energy renovation, you also find the energy savings, the payback time and the cost per tonne of CO2 avoided.
The Site description page gathers every characteristic fetched for the property.
Step by step
1. Complete the data only you know
Some information does not exist in public data. Entering it in the Site description makes the results more accurate. For example:
- accessibility: the number of homes already adapted, per level;
- summer comfort: whether there are ceiling fans, the type of surroundings, and the share of residents aged 60-74, 75-89 and 90 and over (otherwise, the module uses the age pyramid of the municipality);
- clay: the type of foundations, the cracks observed, the works already done;
- flooding: where the boiler room is, whether there are non-return valves, lifting pumps or flood barriers.
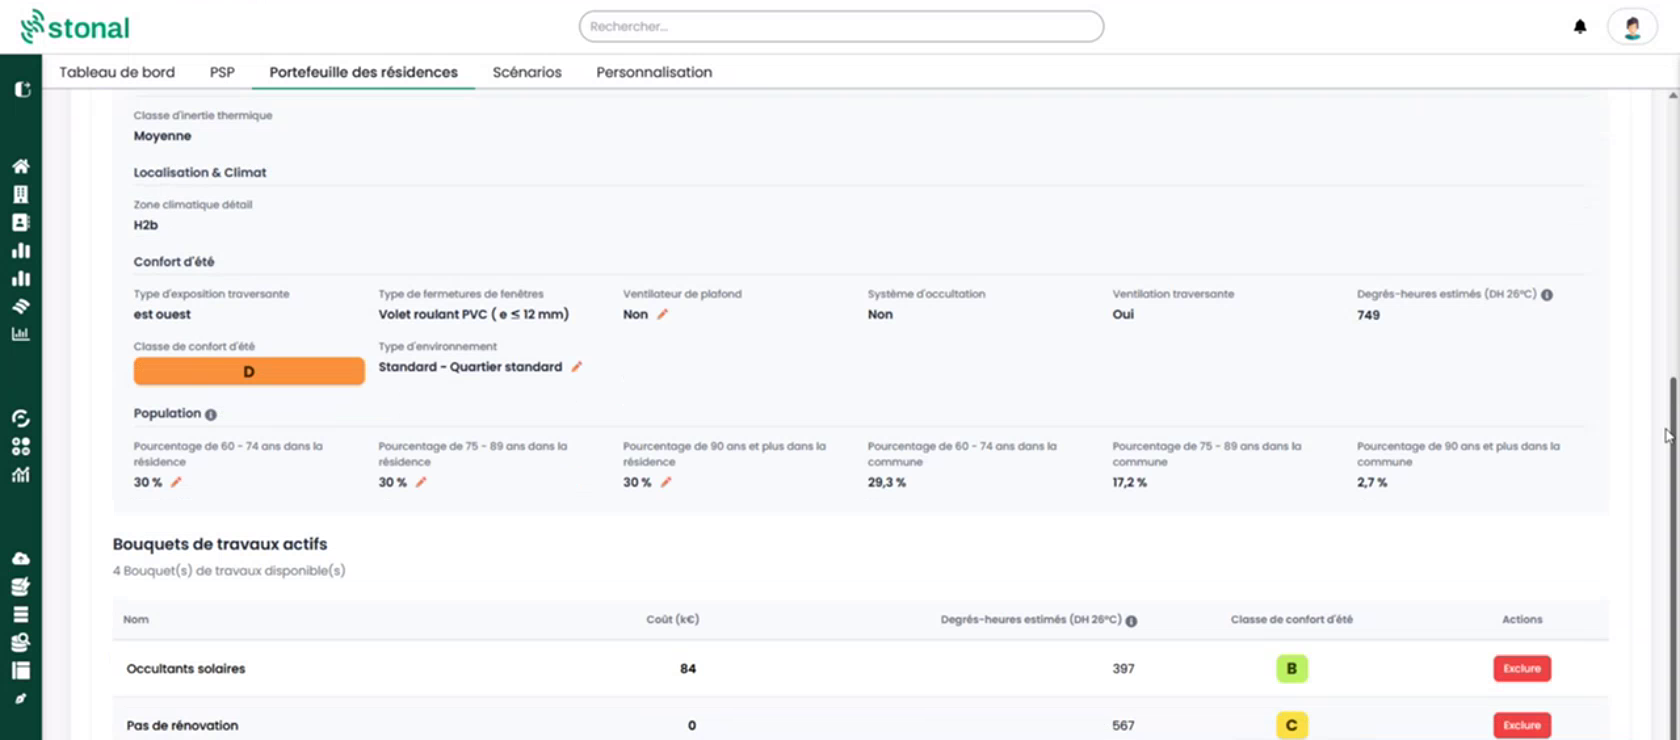
A change immediately recomputes the score of the axis. The packages concerned are recomputed right after.
Regulations assume a home is empty during the day, whoever lives there. The module takes the residents' age into account to get closer to reality. A property with many elderly residents sees its heat exposure rise, and becomes a priority in scenarios.
2. Set aside the packages that do not suit you
On a property's record, the Exclude button removes a package for that property, Reactivate brings it back. To remove a package from all your properties, use the Customisation page.
3. Create a scenario
On the Scenarios page, click New scenario. The wizard takes you through seven steps: the scenario name, one step per axis, then a summary. You can skip an axis with Skip, but at least one must be configured.
For each axis, first choose an Optimisation goal:
- Best performance for a budget: the module looks for the best result within your budget;
- Reach a minimum class at the lowest cost: for example, the whole portfolio in class C at least. A property that cannot reach the target class gets the package that comes closest. This option does not exist for accessibility.
Then set the parameters:
| Parameter | Effect |
|---|---|
| Max budget | Optional, in k€. Without a budget, you get the best possible solution and its cost |
| Performance/budget trade-off | Towards "Performance", the module spends up to the budget for the best result. Towards "Cost", it looks for the best gain per euro spent |
| Indicator to optimise | Energy renovation only: favour greenhouse gas emissions, consumption, or a mix of both |
| Works distribution strategy | Accessibility only: Balanced coverage of the portfolio spreads adapted homes across your whole territory; Concentration / pooling of works groups them in large properties |
| Select properties | Limit the scenario to part of the portfolio, with the same filters as the portfolio page |
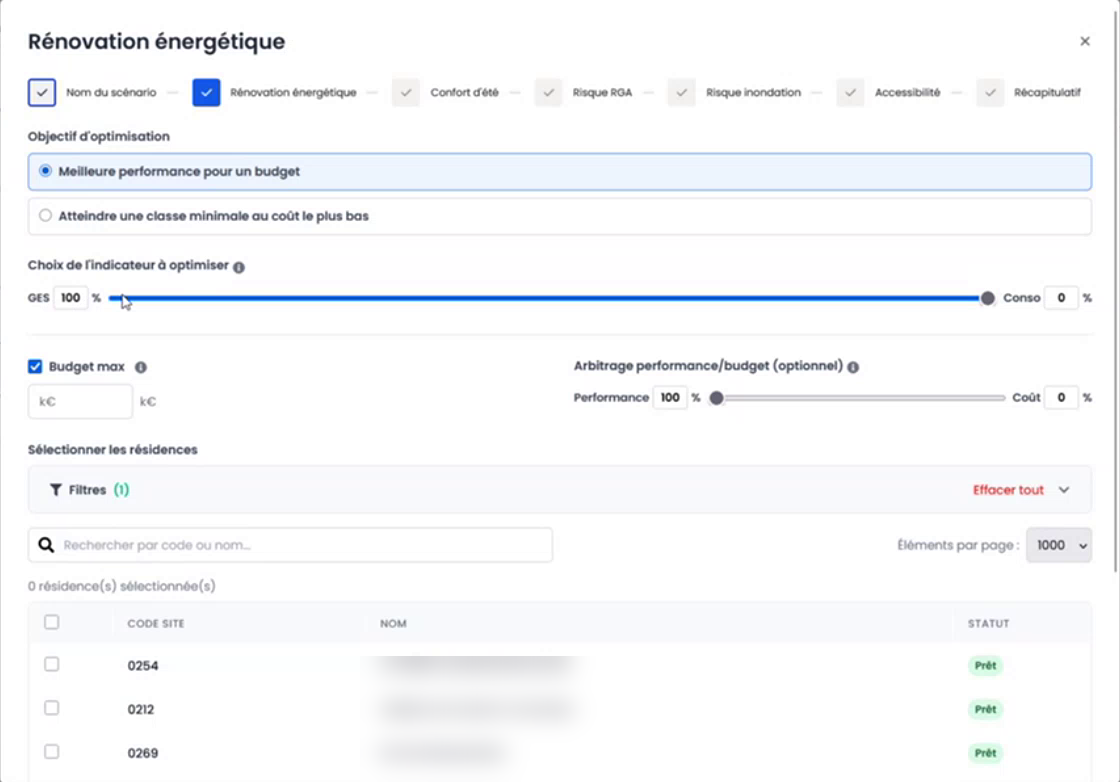
A first scenario without a budget gives you the cost of the best possible solution. It then serves as a benchmark to set a realistic budget.
Each axis is computed with its own budget: the axes do not share a common envelope.
4. Read the result
A ready scenario shows:
- global metrics: properties, homes and areas to renovate, total cost;
- one tab per axis: total cost, cost per home and per m², share of homes renovated, class distribution before and after works;
- for energy, in addition: emissions and consumption saved, financial savings, cost per energy class gained, payback time;
- Aggregated actions: how many of each type of works across the portfolio (hot water tanks, ceiling fans, flood barriers…), and their cost;
- View by site: the package chosen for each property, with a link to its record.
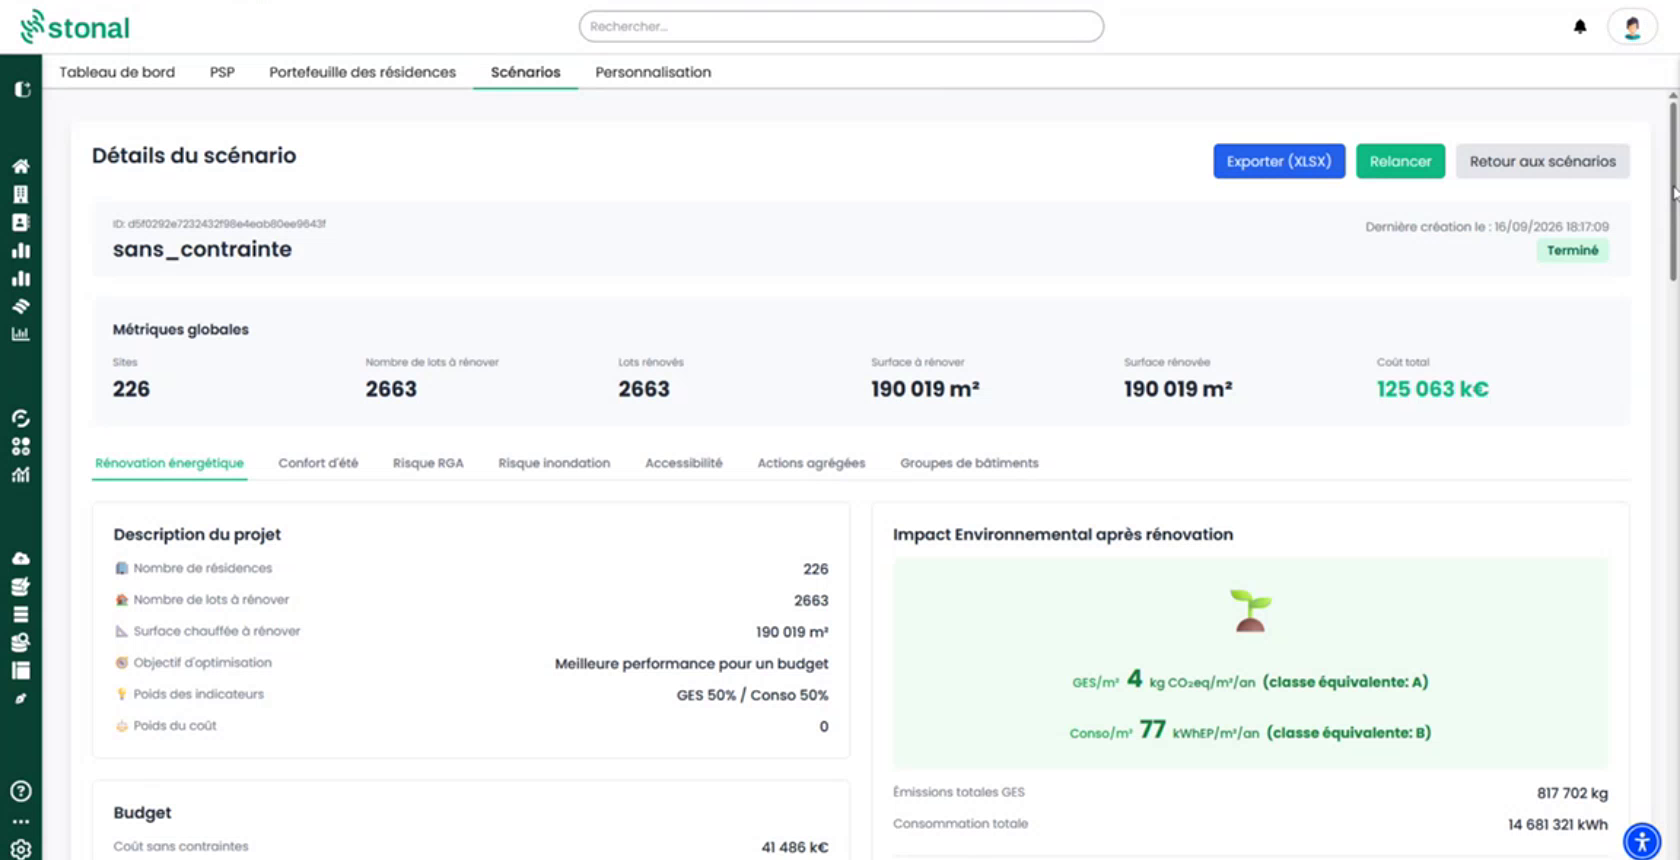
The Export (XLSX) button produces an Excel file with four sheets: summary, results by group, works, works by property. Rerun reopens the wizard with the same settings, for example after your data has been updated.
5. Compare two scenarios
On the Scenarios page, tick exactly two scenarios and click Compare. Both results are shown side by side, with the same tabs.
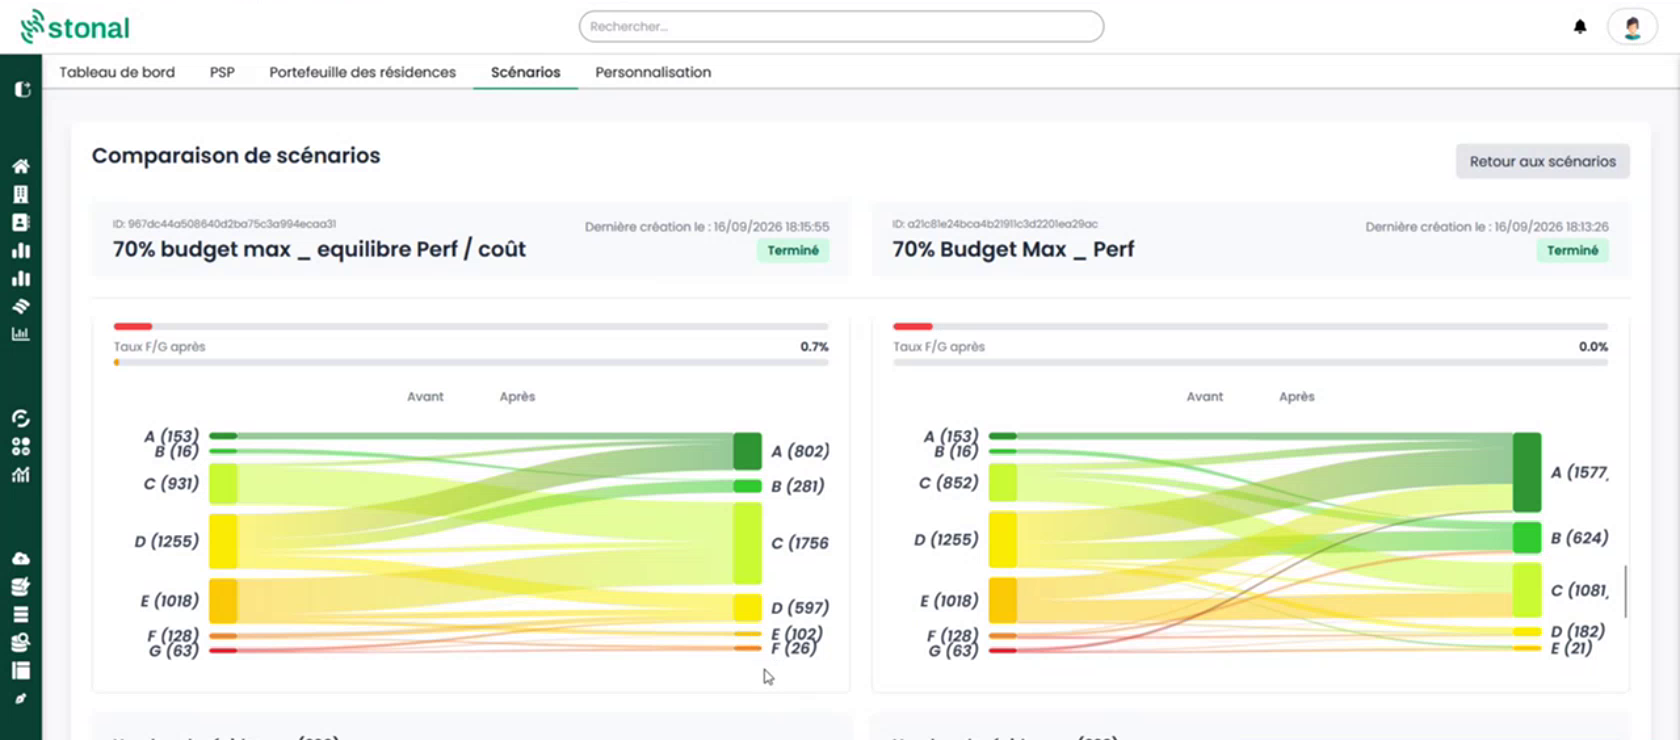
On the same portfolio, an "everything in class C" scenario can cost more than a scenario that balances cost and performance, and end up with a slightly lower average performance. In return, it guarantees that every property with homes below class C gets a renovation solution, whenever one exists. Conversely, the balanced scenario leaves out of the programme the properties judged too costly to renovate. The comparison sets side by side what you gain and what you pay, and the choice is yours.
6. Adapt packages and prices to your practice
The Customisation page has two tabs.
Works packages:
- Exclude this works package for all your properties, or include it again;
- Add a custom action to a package, for example scaffolding or an audit;
- Custom constraints: keep a package for properties with given characteristics. Example: only accept individual heat pumps in properties that have balconies. Your constraints add up to Stonal's, which cannot be changed.
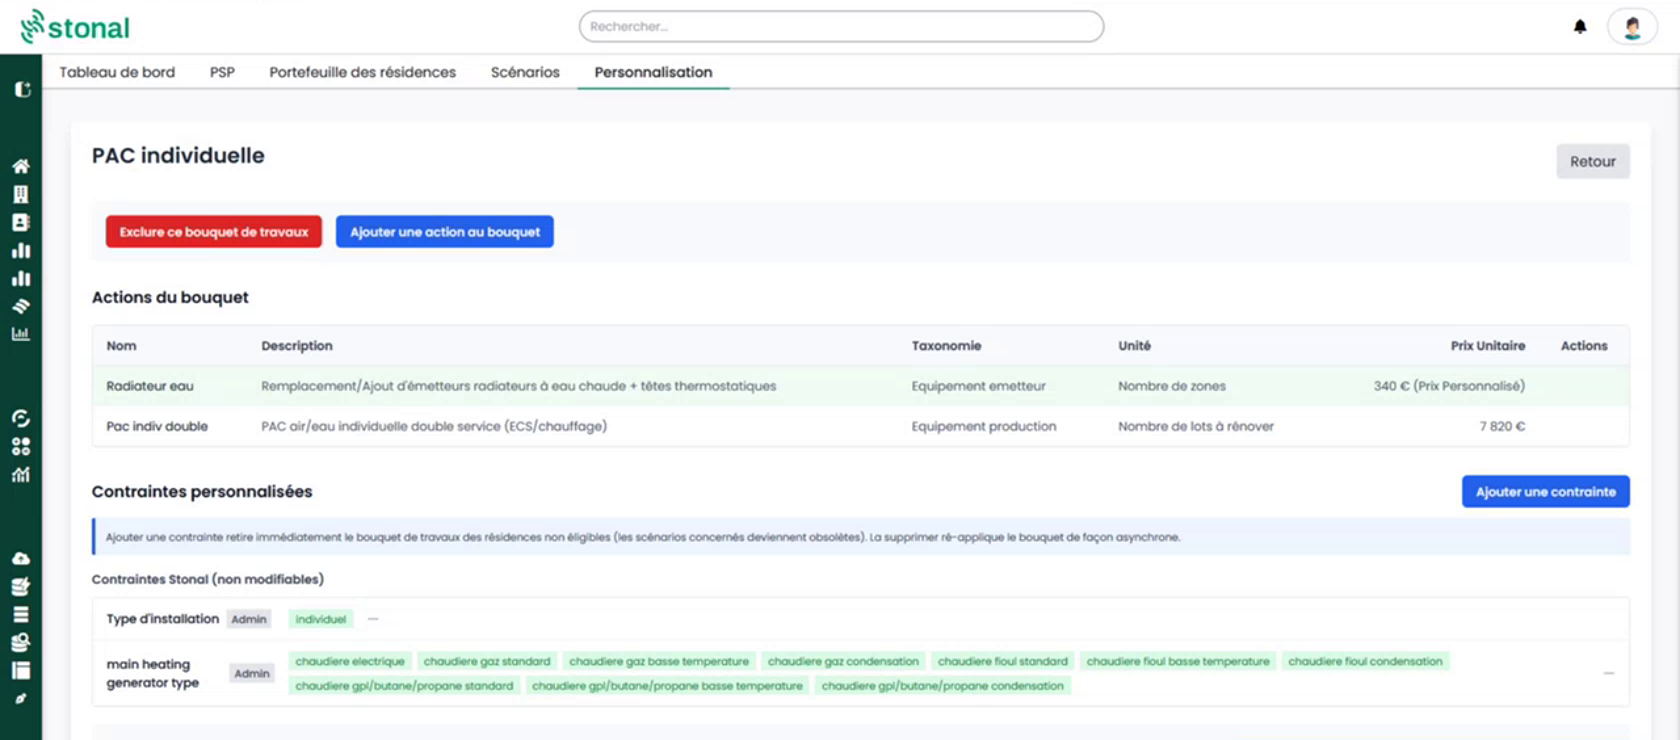
Actions:
- enter a Custom price instead of the Stonal price;
- Create a new action with its name, description, unit and unit price.
Any change reruns the computation of the packages concerned.
How the module computes
Where works packages come from
- Energy renovation: the packages are built from the works and equipment recommended by ADEME, the French ecological transition agency, which have a real effect on the energy label.
- Other axes: packages built by Stonal from real audits, grouping works that are done together.
- Each package is only offered to buildings that can take it. For example, no external insulation on stone or brick walls, nor within a historic monument perimeter; a district heating connection only if a network runs nearby.
- Current packages apply to occupied properties.
A package becomes inactive, marked Discarded, when another package for the same property does at least as well for a lower or equal cost.
The classes of each axis
| Axis | A | B | C | D | E |
|---|---|---|---|---|---|
| Summer comfort (degree-hours) | under 200 | 200 to 400 | 400 to 700 | 700 to 1,000 | 1,000 and over |
| Clay, flooding (risk score out of 100) | under 20 | 20 to 40 | 40 to 60 | 60 to 80 | 80 and over |
| Accessibility (score out of 100) | 80 and over | 60 to 80 | 40 to 60 | 20 to 40 | under 20 |
Energy renovation follows the energy labels from A to G, with the double-threshold rule: the label kept is the worse of consumption and emissions.
Estimates
To cost the works, the module estimates the missing quantities (façade, window and roof areas…) from the building's footprint, height and number of homes. For energy, a prediction model trained on energy performance certificates estimates consumption and emissions after works. These are orders of magnitude to compare and decide, not a quote: your prices and constraints, entered on the Customisation page, bring them closer to your reality.
Good to know
- Accessibility: there is no public data on adapted homes. Until you have declared your adapted homes, your properties (except those built from 2018 onwards) show in class E.
- Scenarios are personal: a colleague in your organisation does not see yours.
- A banner warns you when data has changed since a scenario was computed: click Rerun to update it.
- The module relies on French public data (BDNB, Géorisques, INSEE): it covers properties located in France.
- Access to this module depends on the scope chosen by your organisation and on the rights granted to you. If you need it, get in touch with your contact person.
See also
- Works plans: multi-year planning of your works